Pavement requests are running 40% above the five-year average for this week of the year. The response queue is already stretching.
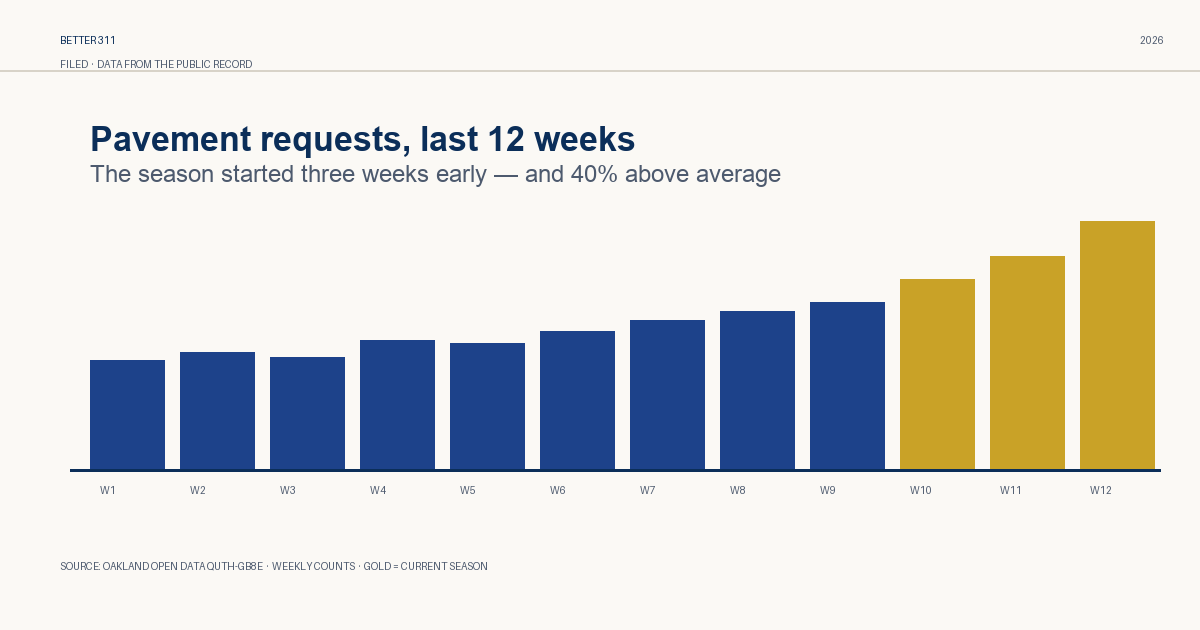
Oakland's pothole season showed up early this year. Requests began climbing in the first week of September, three weeks ahead of the usual rise in the five-year series. The count for this week is 40% above the recent average.
The 311 file splits pavement complaints across several categories. The two that belong in this story are "Pothole" and "Street Pavement Condition." Together they produced 1,142 requests in the last 30 days. That is the highest early-season total in the sample.
The timing changes the workload before winter arrives. At this volume, a pavement request takes a median of 9 days to reach first action. In the busiest corridors, the median stretches to 14 days. A few weeks of extra reports can turn a repair queue into a backlog.
Sobrante Park, the MacArthur corridor, and the flatlands east of Lake Merritt have the most requests in this sample. They also led the list last season. The pattern is familiar. The early start is not.
This brief, plus four more numbers and one chart, every Monday at 7 AM. Free forever.