
Filed
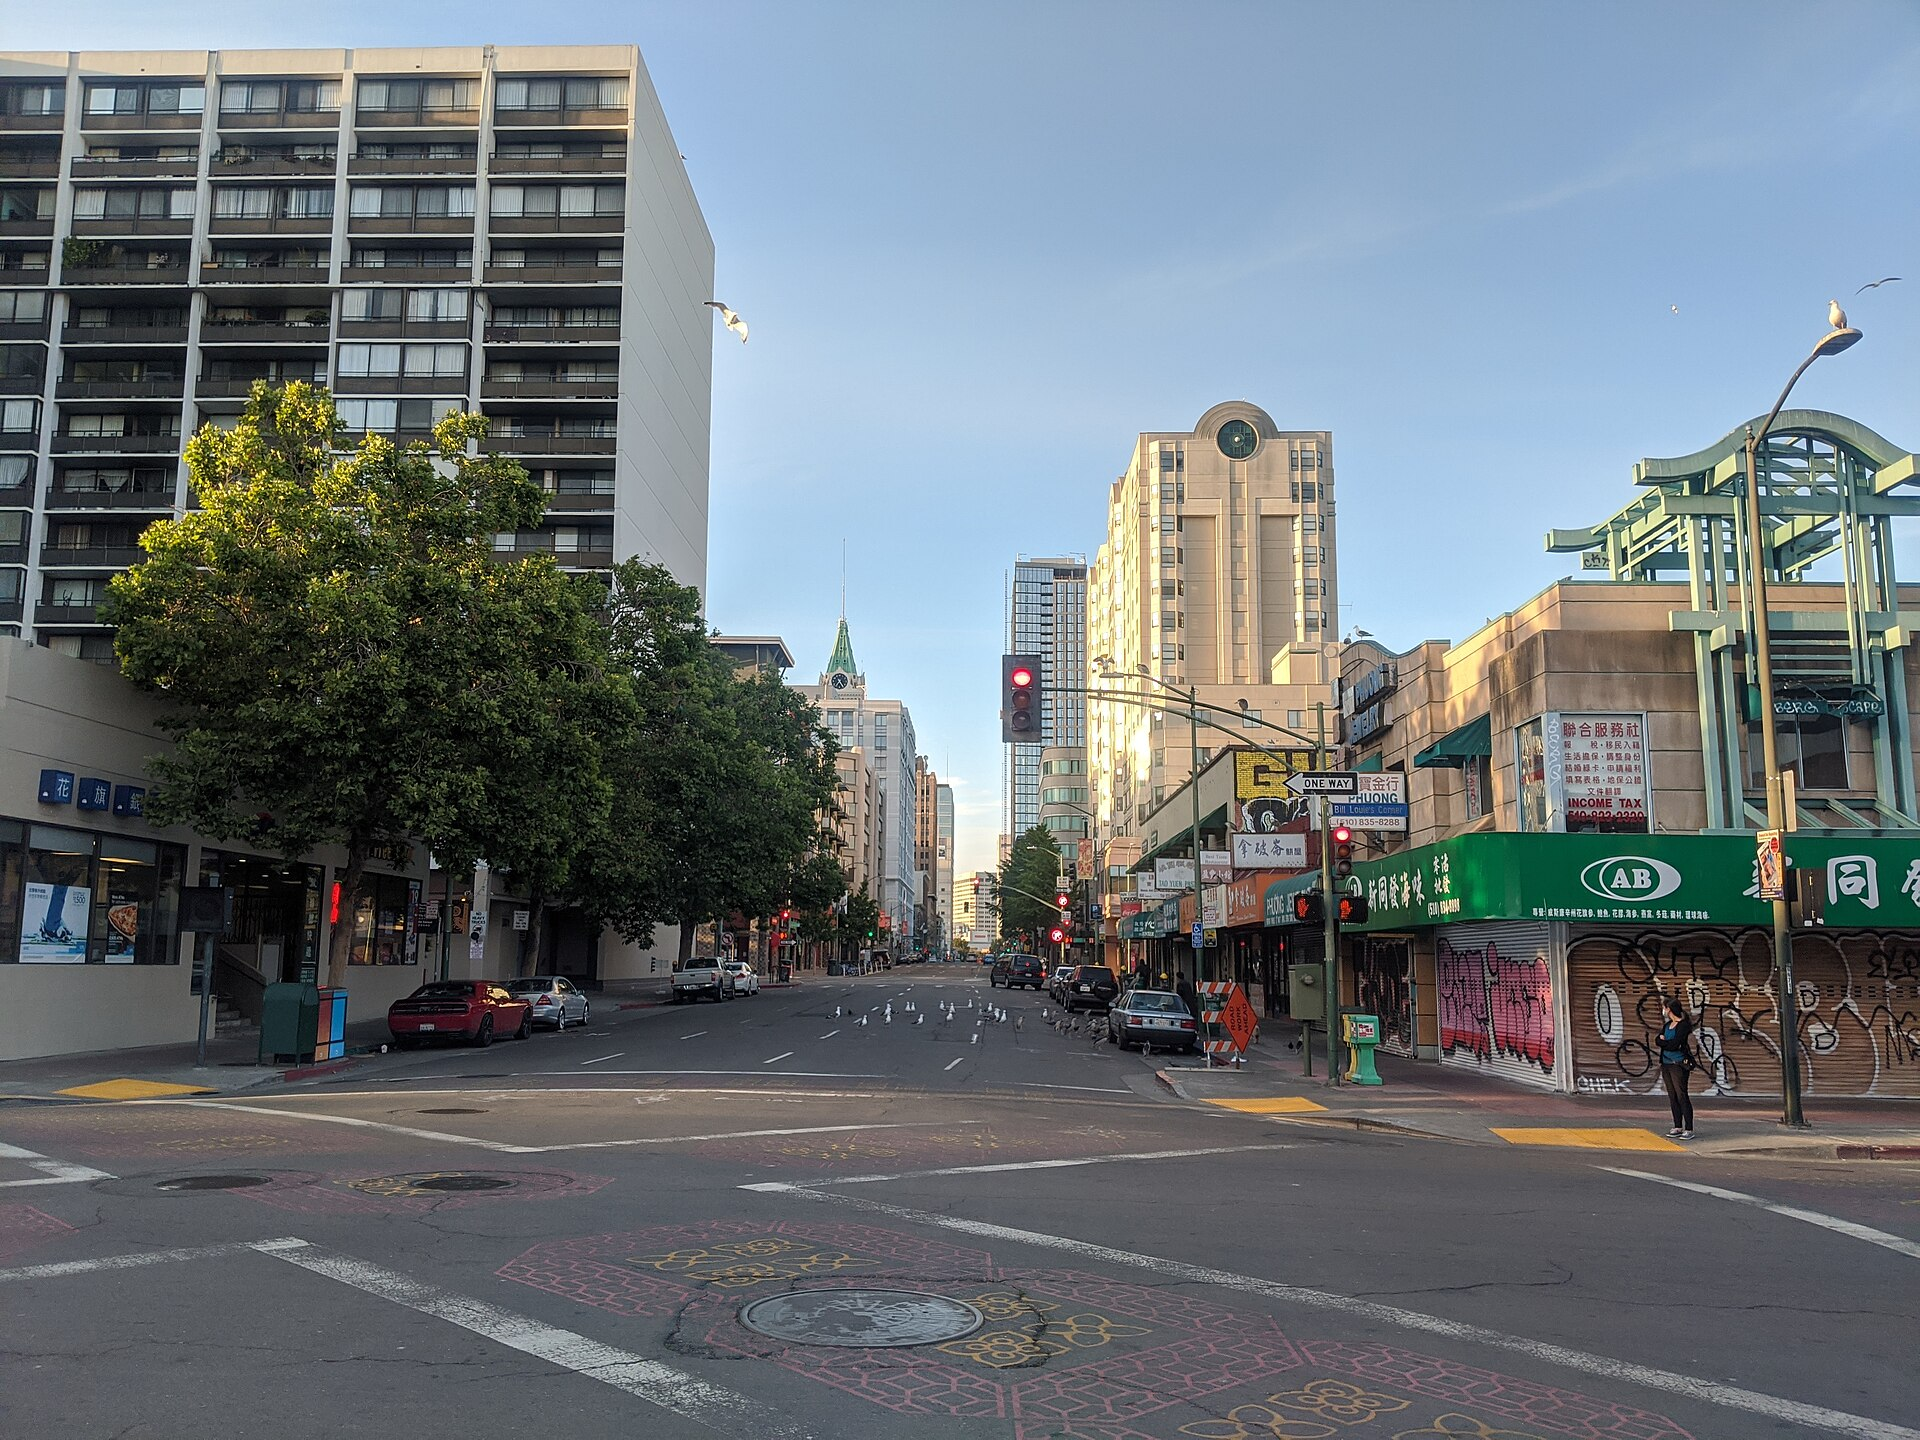
A week ago we reported that "closed" does not mean clean. This week the file says something else: 508 illegal-dumping reports in seven days, up 46 percent.
The surge is not citywide noise. District 5 is up 158 percent. District 4 is up 78 percent. District 2 is up 51 percent. Every district in Oakland filed more dumping reports in the last seven days than its recent average.
| District | 7-day total | Change vs prior |
|---|---|---|
| CCD3 · West Oakland | 111 | +40% |
| CCD6 · Central Oakland | 94 | +15% |
| CCD7 · East Oakland | 93 | +36% |
| CCD5 · East Oakland | 61 | +158% |
| CCD2 · North Oakland | 59 | +51% |
| CCD1 · West Oakland | 44 | +43% |
| CCD4 · Central Oakland | 41 | +78% |
| All districts | 508 | +46% |
District 5 covers Sobrante Park, Elmhurst, and the flatlands of East Oakland. It is the district where the flagship's own numbers showed the slowest closures. Now it is also the district where the reports are climbing fastest. The two facts belong in the same story.
The pattern from the flagship holds: closures are bookkeeping. The record marks a report closed when the paperwork is done. It does not mark when the pile is gone. This week the book is filling faster, and the districts filling it fastest are the ones the record already says are the slowest to close.
What you can do with this: report what you see, and track what happens after. The OAK 311 file is public. Every request, every status, every district. The record is the accountability. It only works if someone reads it.