 Better 311Filed
← All briefs
Better 311Filed
← All briefs
Better 311Filed
← All briefs
Better 311Filed
← All briefs
The metro unemployment rate rose from 3.6 percent in May to 4.2 percent in June. That is the same jump the file has shown every June since 2019. The question is what it means when the seasonal bump fades.
 Laura Chen
·
Sep 2, 2026 · 6:05 AM PT
·
4 min read
Laura Chen
·
Sep 2, 2026 · 6:05 AM PT
·
4 min read
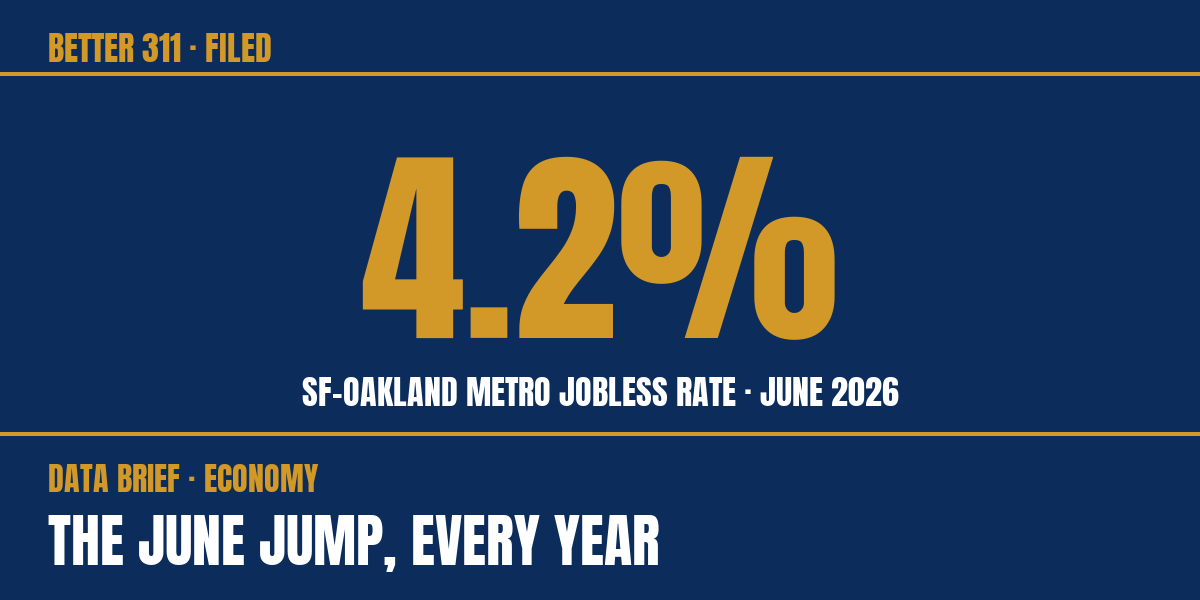
The number that jumps out of the June file is 4.2 percent. That is the unemployment rate for the San Francisco-Oakland-Hayward metro area, and it is up six tenths of a point from May's 3.6. Before you read that as a sudden turn in the labor market, read the calendar: the same jump shows up every June.
May's 3.6 percent was the metro's lowest reading since spring 2023. The June move erased it in one month. But the file has done this before, almost to the decimal. From May to June, the metro rate rose half a point or more in 2019, 2021, 2022, 2023, 2024, 2025 and 2026. The 2025 jump was also six tenths of a point, from 4.0 to 4.6. The pandemic year, 2020, is the only June in the stretch that did not rise, because the rate was still falling from its spring peak.
The rest of the region was moving the other way in the same stretch. California's rate was 5.2 percent in June and eased to 5.1 in July. The national rate was 4.2 in June and 4.1 in July. Both are seasonally adjusted series published monthly. The metro file's latest reading is June; the July metro number arrives with the next BLS local area release.
Put the three files side by side and the picture is a narrowing gap, not a break. In May the metro sat 1.7 points below California. In June the gap closed to 1.0 point, because the metro rose while the state barely moved. The metro is still below the state and below its own year-ago reading: 4.2 percent in June 2026 against 4.6 percent in June 2025.
So what is the honest read? The file cannot separate how much of June's jump is the recurring seasonal bump and how much is real cooling. What it can show is that the bump has faded in past summers: in 2019, 2022 and 2023 the rate fell back by August or September. If the pattern holds, the July and August metro numbers will tell you more than June ever could.
If you are job hunting or hiring, the June number alone is not a signal to change plans. Watch the metro series for the month after the bump, and watch whether the rate settles above 4 percent. That would be new. A June spike that recedes by September is the same movie the file has played every year.
Five numbers, one chart, one story like this, every Monday at 7 AM. Free forever.